This site hosts custom visualisations of meteorological data, primarily requested through the Danish Meteorological Institute's (DMI) open data API. To acquire, process and visualise the data, several self-developed python scripts are used, using a number of open source python libraries. For now, this site serves no commercial purpose, and is free for anyone to use. The motivation behind creating the site stems from wanting more professional level visualisations of available meteorological data for Denmark, and setting up and expanding the site is an ongoing project. As I, Rune Zeitzen, am the sole contributor to the project, deplyoment may be slow, especially given i have to write my masters thesis!
The goal of this website is to have a fully functional site, that presents meteorological data in a professional and streamlined manner. Furthermore, for usability, the website has been designed to work optimally on both computers and mobile devices.
A rewrite of the NWP backend resulted in far lower server requirements, and as such, the NWP Charts have been opened for everyone. Furthermore, a new Model, the ECMWF IFS model, has been added! Enjoy!
A new page for the HARMONIE DINI NWP model run by DMI has been added, however, is only accessible to select users, due to high server costs. Access may be requested by contacting me, however, due to limitations in server capacity, may not be granted.
A new Multi-Sensor QPE algorithm (MQPE) has been developed, where the radar estimated field is compared to DMI Pluvio rain gauge measurements from the same timespan, and a bias correction is performed, to account for the weaknesses of pure radar QPE. The new method is more robust and reliable, and does not have the same diverging characteristics. Please note that the data is NOT an official estimation of precipitation, and it is not independantly verified or endorced by DMI. As of the release of this product, this is the only freely available MQPE product for Denmark. The data time has now also been extended for the past 24 hours.
New experimental feature on the "Radar" page, for both 3 and 12 hour quantitative precipitation estimates (QPE) using radar data. As the product uses a general dBZ conversion, the algorithm may struggle with non-standard precipitation, such as snow. As the product is in its experimental phase, estimated accumulations may deviate significantly from observed.
New synop charts for the current Visibility, Snow Depth, Relative Humidity, MSLP, Global Radiation, Sunshine Duration Today and the Minimum Grass Temperature Today have been added to the "Synop" page, and can be found under "Miscellaneous"!
New synop charts for the current Wetbulb Temperature and Dewpoint Temperature have been added to the "Synop" page, and can be found under "Processed"!
A new synop chart for the current Windchill has been added to the "Synop" page, and can be found under "Processed"! Furthermore, placeholders for Heat Index, wetbuld temperature and dewpoint temperature charts have been added under the same page, as they are being developed at the moment. Their implementation is slowed due to time constraints (I have a thesis to write).
New plots the Lightning today and the past 24 hours have been added under the "Lightning" page!
New synop charts for Precipitation totals today, the past 24 hours, the past 48 hours, and the past 72 hours have been added to the "Synop" page! Furthermore, a new Skybrud page has also been added to the "Synop" page.
The first version of the Radar page has been added! It can be found under the "Radar" page. The viewer features both on screen buttons, keybindings, and an interactive toggle slider, which also works on mobile devices! The radar viewer shows the past 4 hours of radar images, and is updated every 10 minutes. The data has time intervals of 10 minutes. More updates to the radar page are planned, including extended time ranges, and custom/historical ranges.
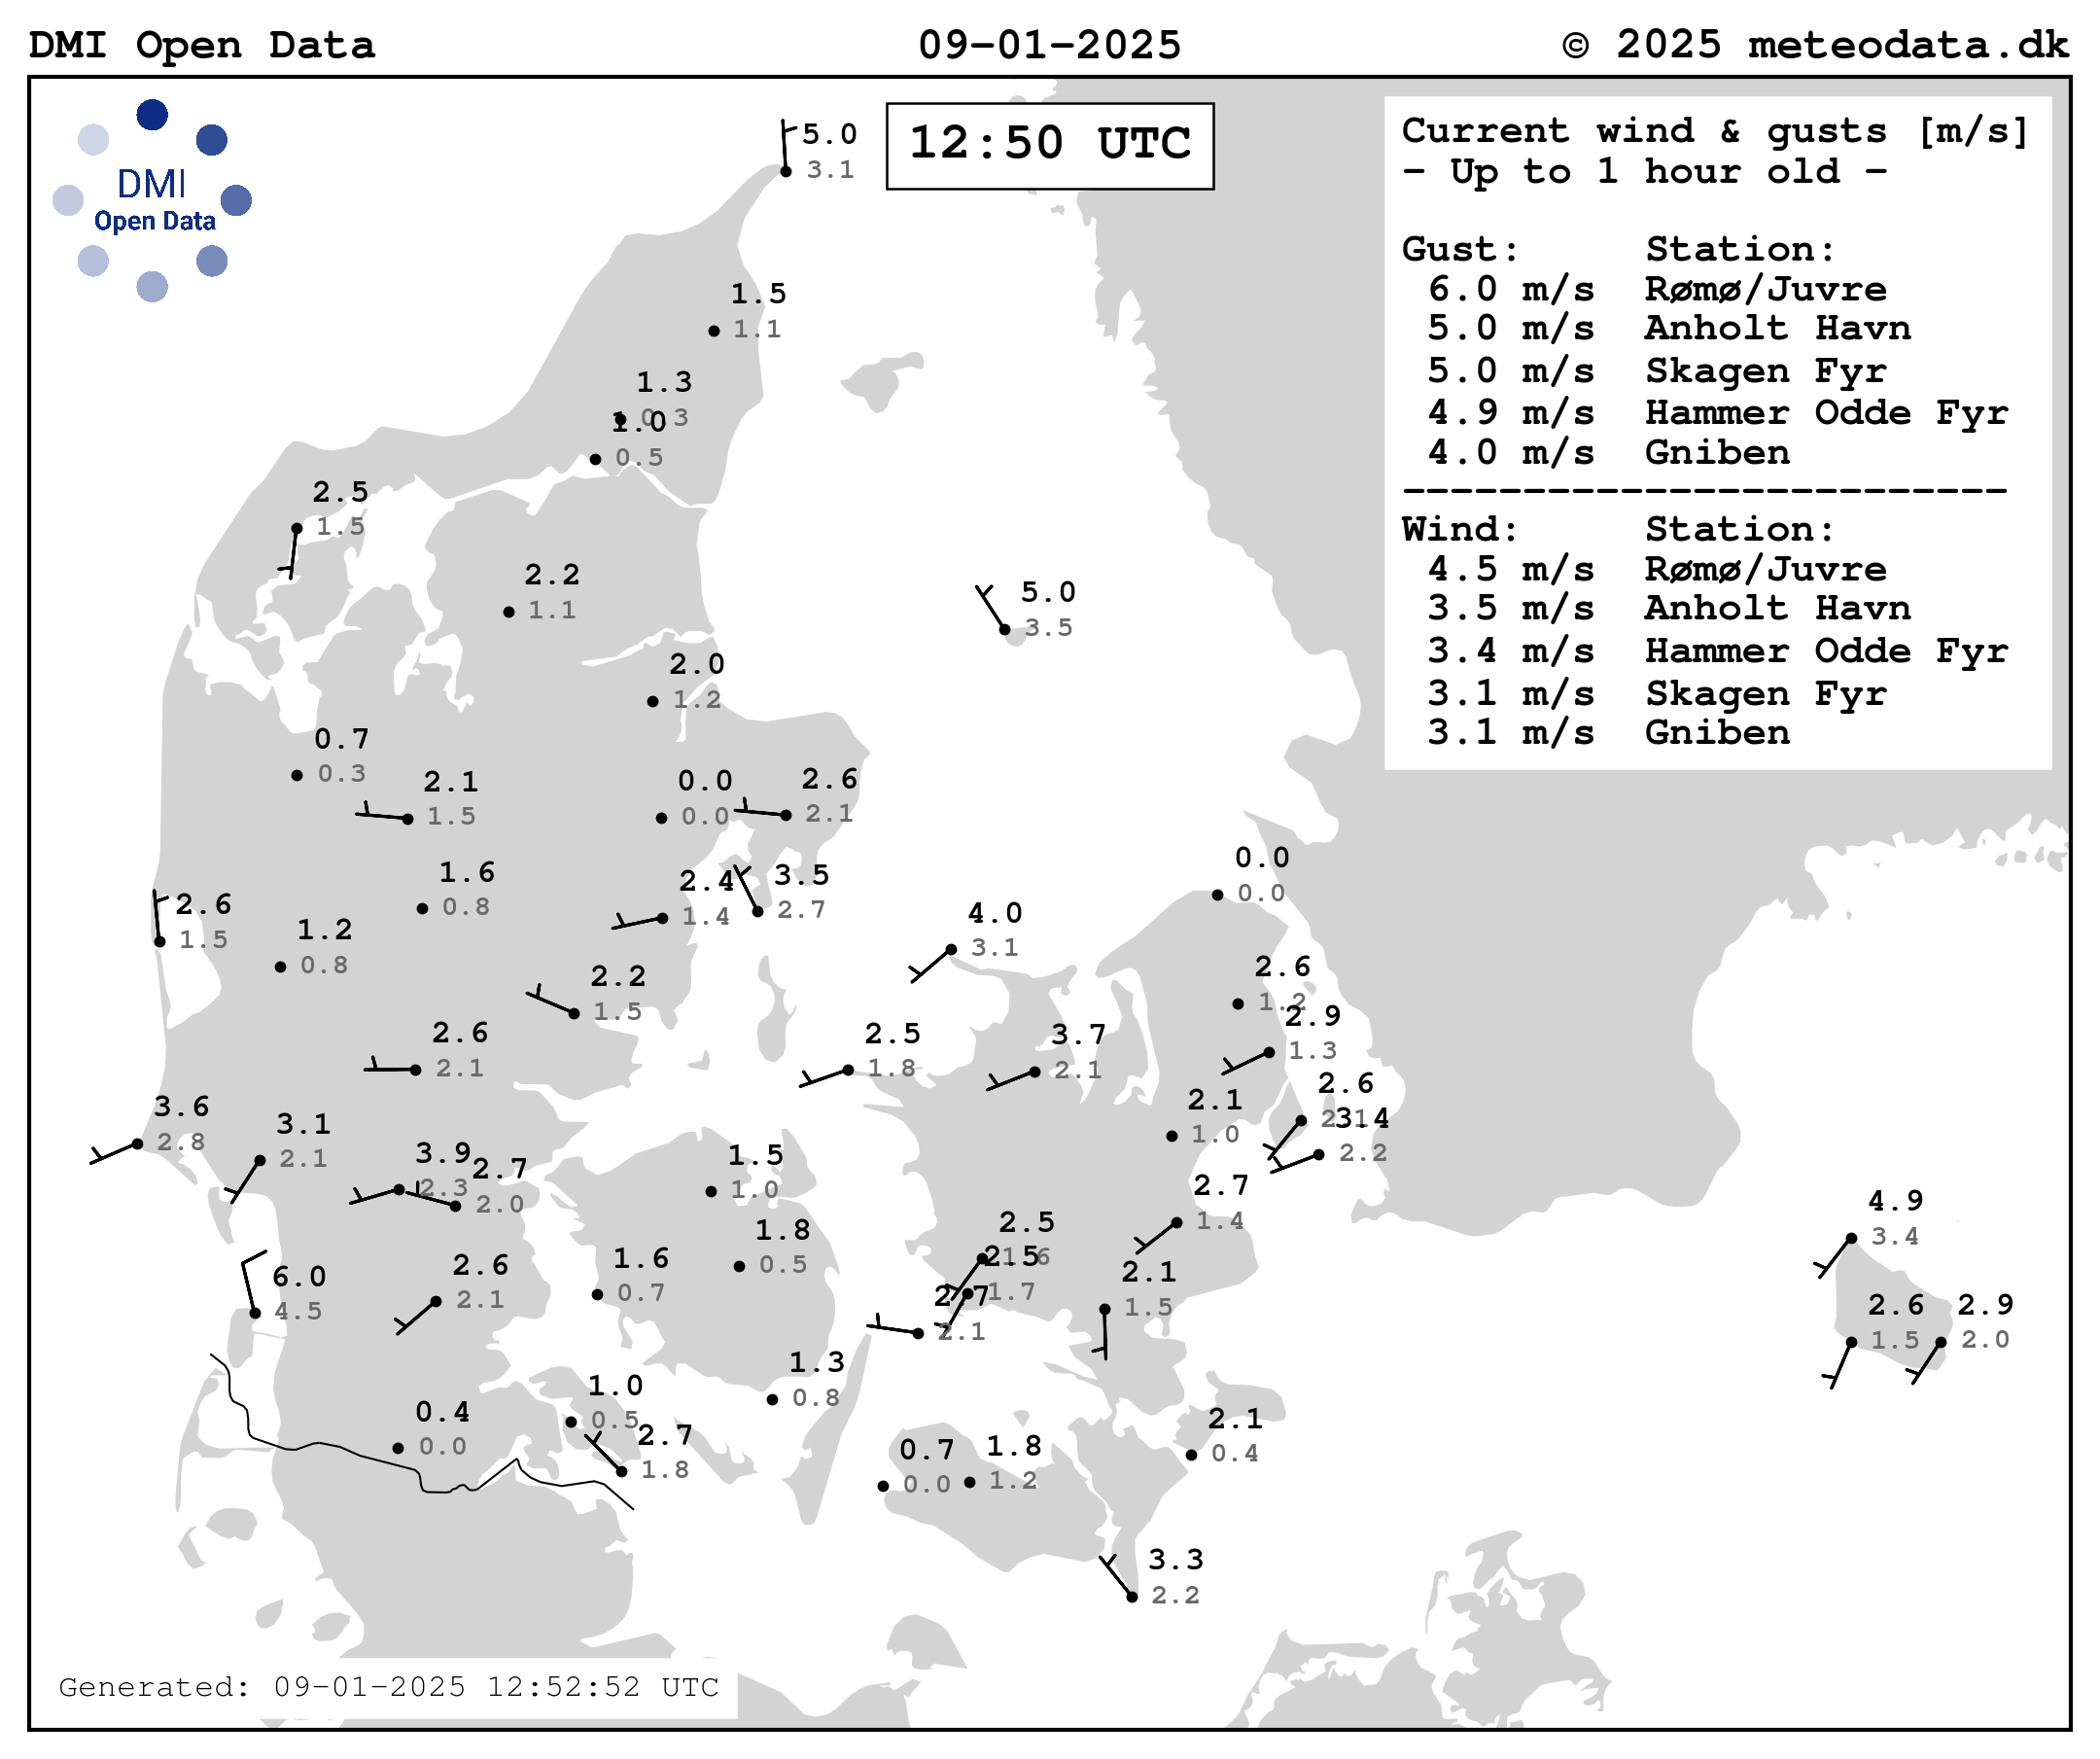
New synop charts for Wind have been added to the "Synop" page, under "Wind". Here, charts for the current windspeed and direction, the maximum windspeeds and maximum gusts can be found. The charts area automatically updated every 10 minutes.
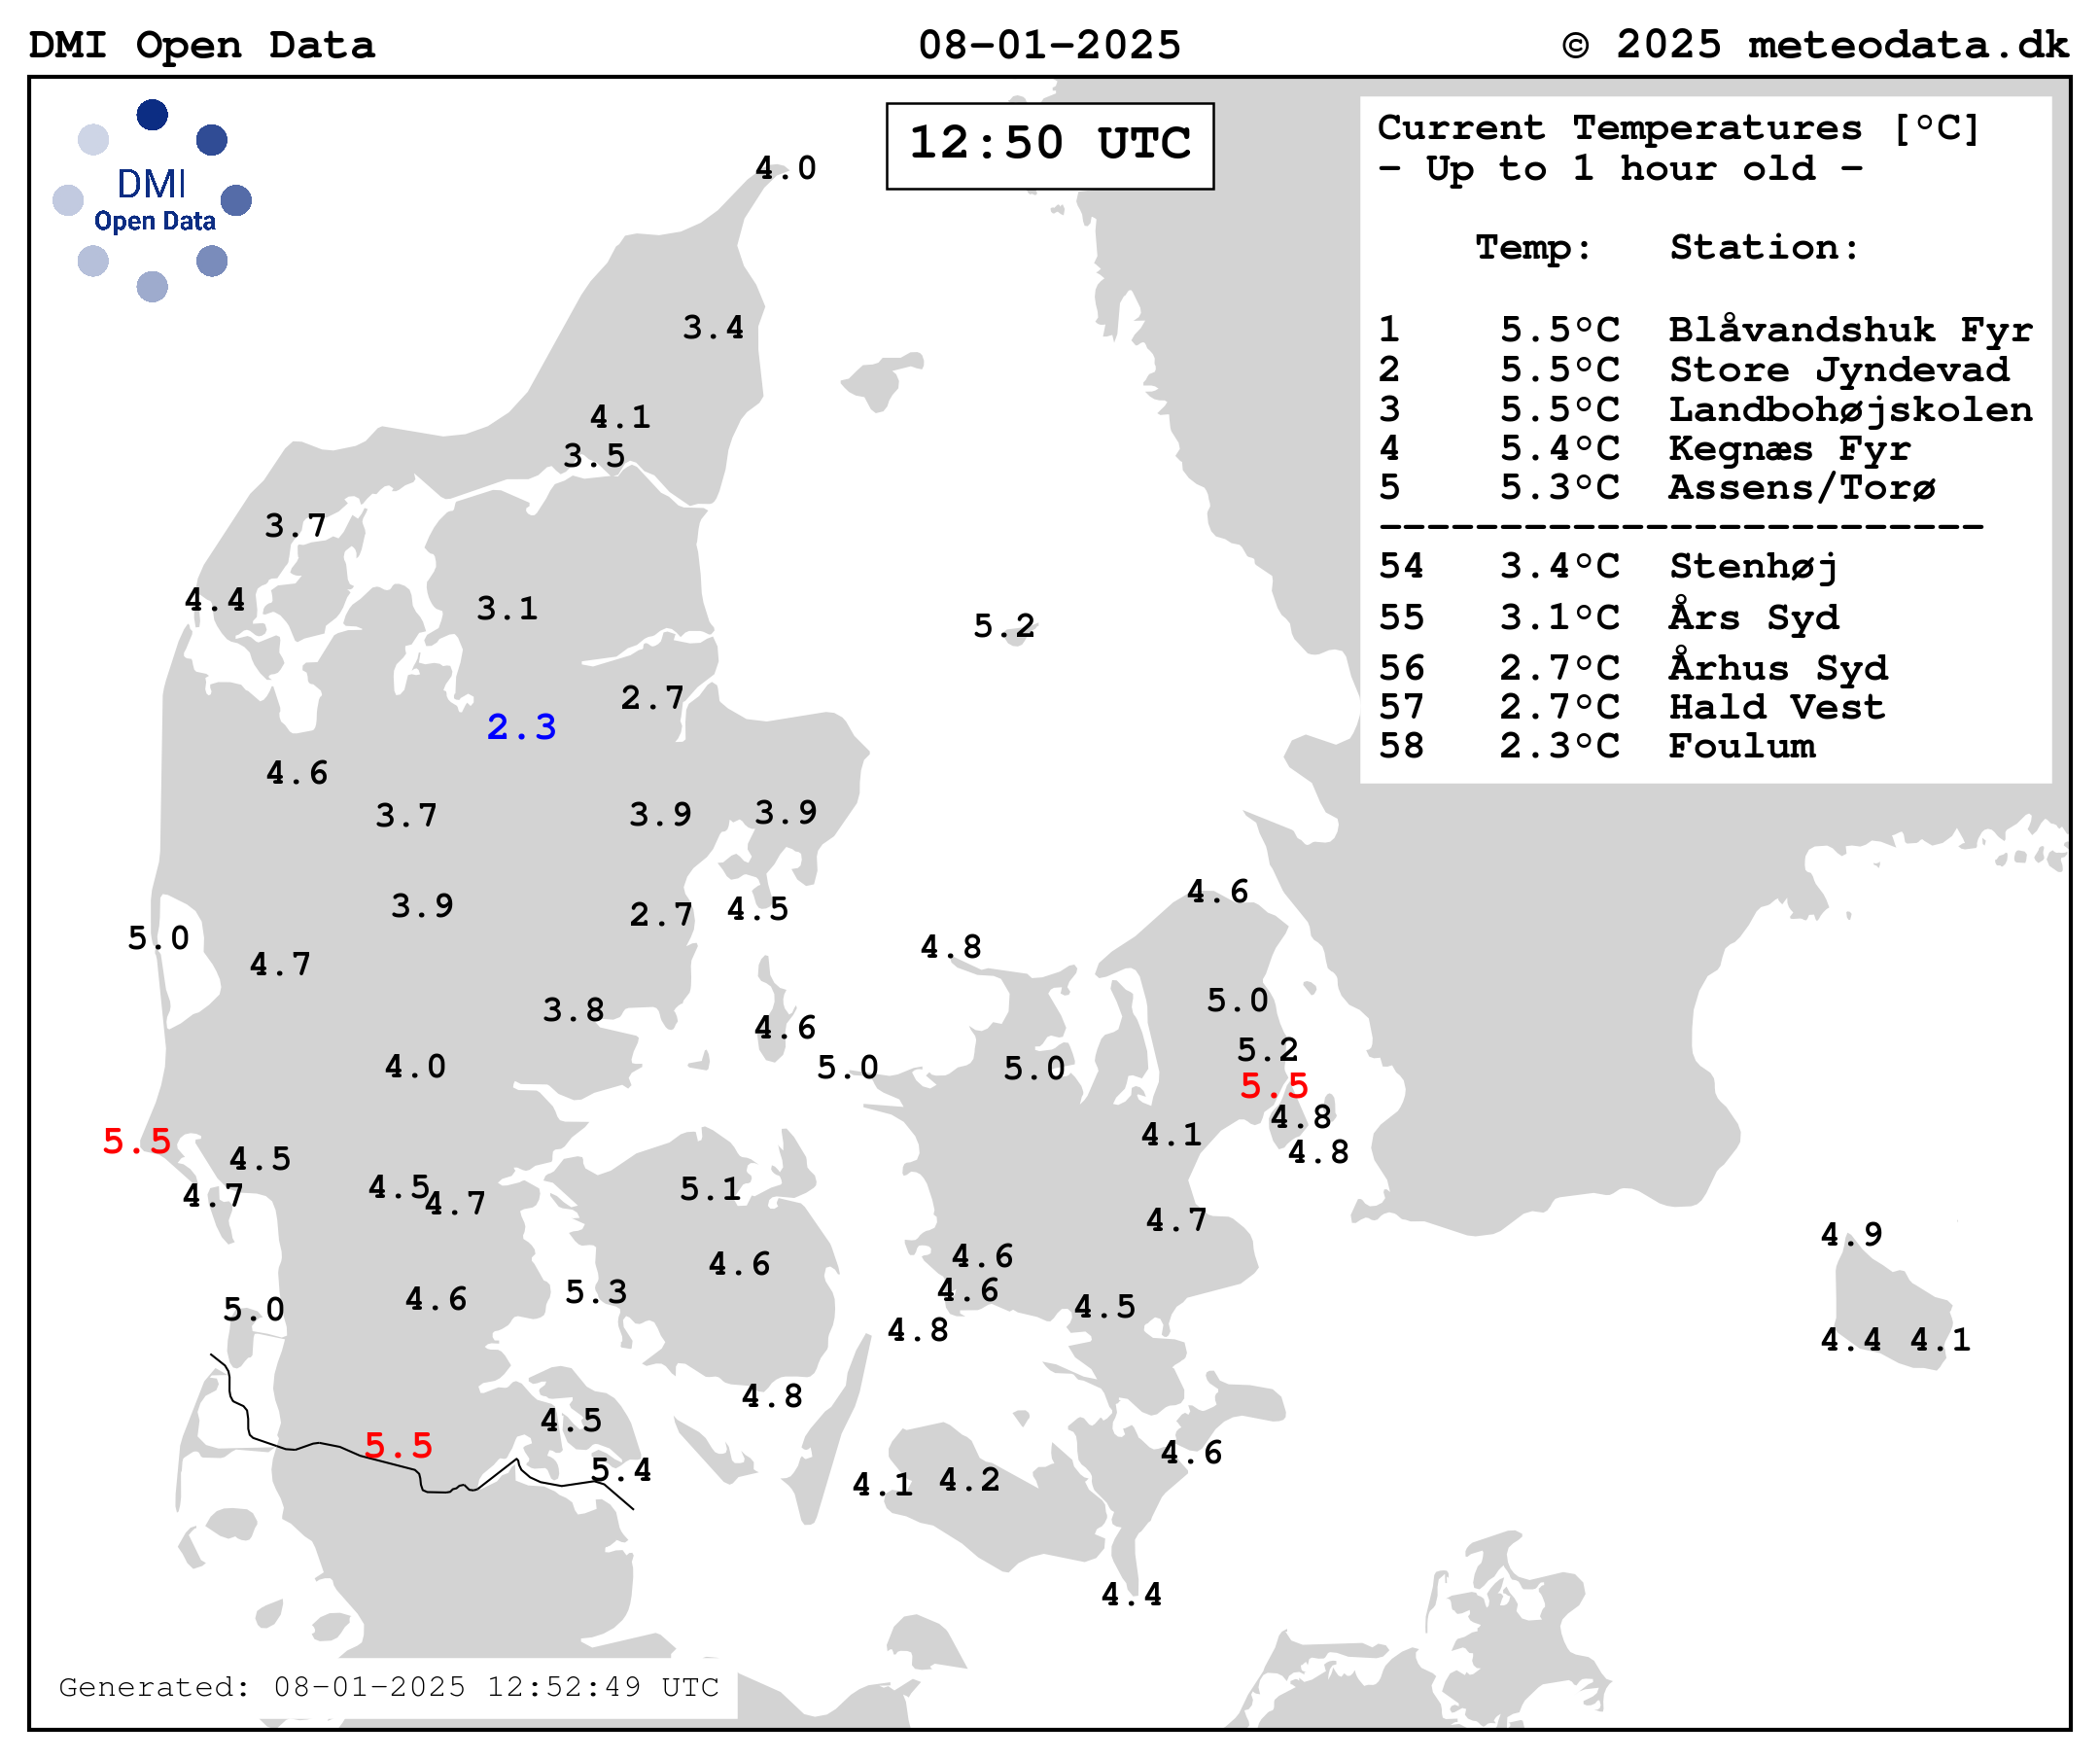
The first synop charts for Temperature have been added to the "Synop" page, under "Temperature". Here, charts for the current temperature, the maximum and minimum temperature can be found. The charts area automatically updated every 10 minutes.
Updates will follow soon!
(Depending on how my Masters thesis is doing)